Pi-hole
listens on 53
A Pi-hole fails in the quietest way there is. pihole-FTL dies, DHCP keeps handing out leases, every device stays online, and the ads come back. Nothing on the network says anything is wrong; you find out because a page looks different than it did yesterday.
Its admin panel lives on port 80 inside the container, not on the 3000 you published. Chillbox asks the container rather than the host, which is why the button lands on the panel and not on a setup screen.
AdGuard Home
listens on 53
Filtering stops before anything else does. The process stays up, the interface answers, and queries start resolving straight through. The first sign is usually an ad on a device you have not seen an ad on in months.
Port 3000 is the setup wizard, not the admin. Once AdGuard is configured, the panel is on 80, and that is where Chillbox opens.
Home Assistant
listens on 8123
Home Assistant restarts itself often enough that a restart loop hides inside normal behaviour. It comes back, it goes down, it comes back, and the only thing you notice is that an automation fired late, once, a few days ago.
A supervised install and a container install look nothing alike from outside. Chillbox matches both, so it recognises it whichever way you got there.
Plex
listens on 32400
The web interface is the last thing to go. A library that stopped scanning still serves pages, still lists what it knew about last week, and still plays it. Newly added films simply never appear, and that reads as forgetting to copy them.
Plex answers /identity without any credentials, so the check needs no token from you and nothing has to be exposed to the network.
Jellyfin
listens on 8096
Transcoding is where it breaks, and the web interface has no opinion about that. The library loads, the poster art is there, and playback fails on one device while working on another.
Matched by unit, by container image and by process, because people install it all three ways and each one leaves a different trace.
Node-RED
listens on 1880
A flow that stopped does not raise anything. There is no error to find, because nothing errored: the trigger simply never fires again, and the automation it drove is missing rather than broken.
Watched by unit and by process. There is no clever probe here: what matters is noticing the moment it is gone, since nothing else will say so.
Mosquitto
listens on 1883
A broker that stopped accepting connections looks exactly like a broker nobody is publishing to. Silence is both the healthy state and the failure, which is why watching the process tells you nothing at all.
It has no admin panel to open, so Chillbox reports it and stops there rather than offering a button that would go nowhere.
Zigbee2MQTT
listens on 8080
When the bridge drops, the devices do not go offline: they stop being heard. Automations fail one device at a time over hours, and it reads as a flaky sensor rather than as one process that died.
Matched by container image and by process. It sits between your devices and everything else, so it is worth watching separately from the broker it talks to.
OctoPrint
listens on 5000
A print that loses its host does not fail loudly. The printer keeps going or stops mid-layer, and the screen you would have checked is the one that is gone.
Recognised by unit and by process, on the Pi it is almost always running on.
Portainer
listens on 9000
If Portainer is how you manage Docker, Portainer going down takes with it the tool you would have used to look into it. That is the specific reason to watch it from somewhere that is not Docker.
Chillbox watches it over SSH, not through Docker, which is the point: the check does not depend on the thing being checked.
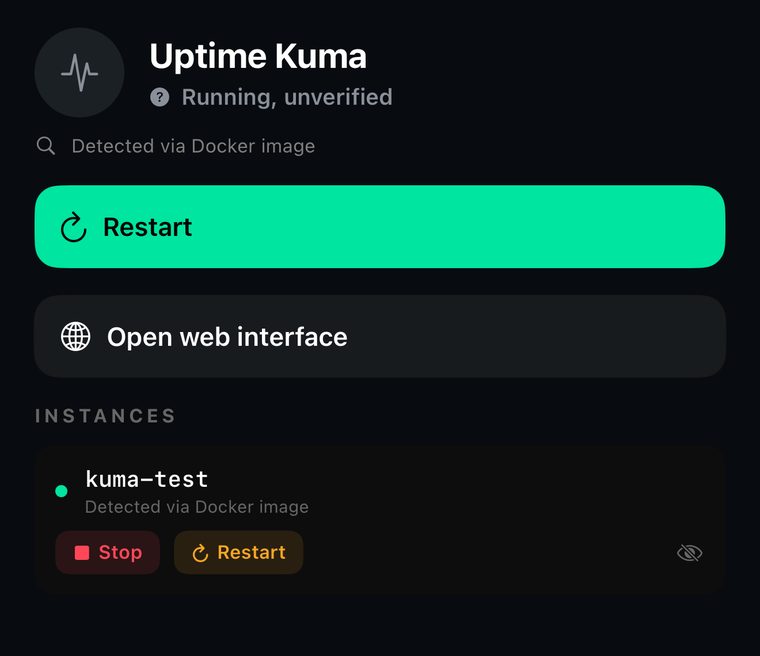
Uptime Kuma
listens on 3001
It is the thing that tells you when everything else breaks, and nothing tells you when it breaks. A monitor that stopped monitoring reports nothing wrong, which is indistinguishable from everything being fine.
The one service where being watched from outside is the entire value, since it cannot report its own absence.
Frigate
listens on 5000
A recorder that stopped recording looks exactly like a recorder in front of a room where nothing happened. You find out when you go looking for footage of something that did happen.
Matched by container image. It is usually the heaviest thing on the box, so its resource usage is worth looking at next to it.
Syncthing
listens on 8384
Nothing syncing and nothing to sync produce the same screen. The failure is a file you edited on the laptop that is not on the desktop, discovered days later, usually while you are somewhere else.
Matched by unit, image and process, because it runs as all three depending on the machine.
Grafana
listens on 3000
Dashboards keep rendering whatever they had. A Grafana that lost its data source shows the last hour it knew about, on a wall, in green, for as long as you let it.
Chillbox checks that Grafana answers, which is a different question from whether the dashboards on it mean anything. It answers the first one honestly and does not pretend to answer the second.
Transmission
listens on 9091
It stops seeding without stopping. The interface lists the torrents, the numbers hold still, and the ratio you were watching just never moves again.
Matched by unit and image. Whether it answers is the check; what it is doing is on its own screen.
Tailscale
no panel to open
When Tailscale drops you lose the path to the machine, which is usually also the path you would have used to check on it. It is the one failure that hides itself by definition.
It has no panel of its own on the machine, so this one is watched, not opened.